| Using Skylendar |
| Prev | Next |
Table of Contents
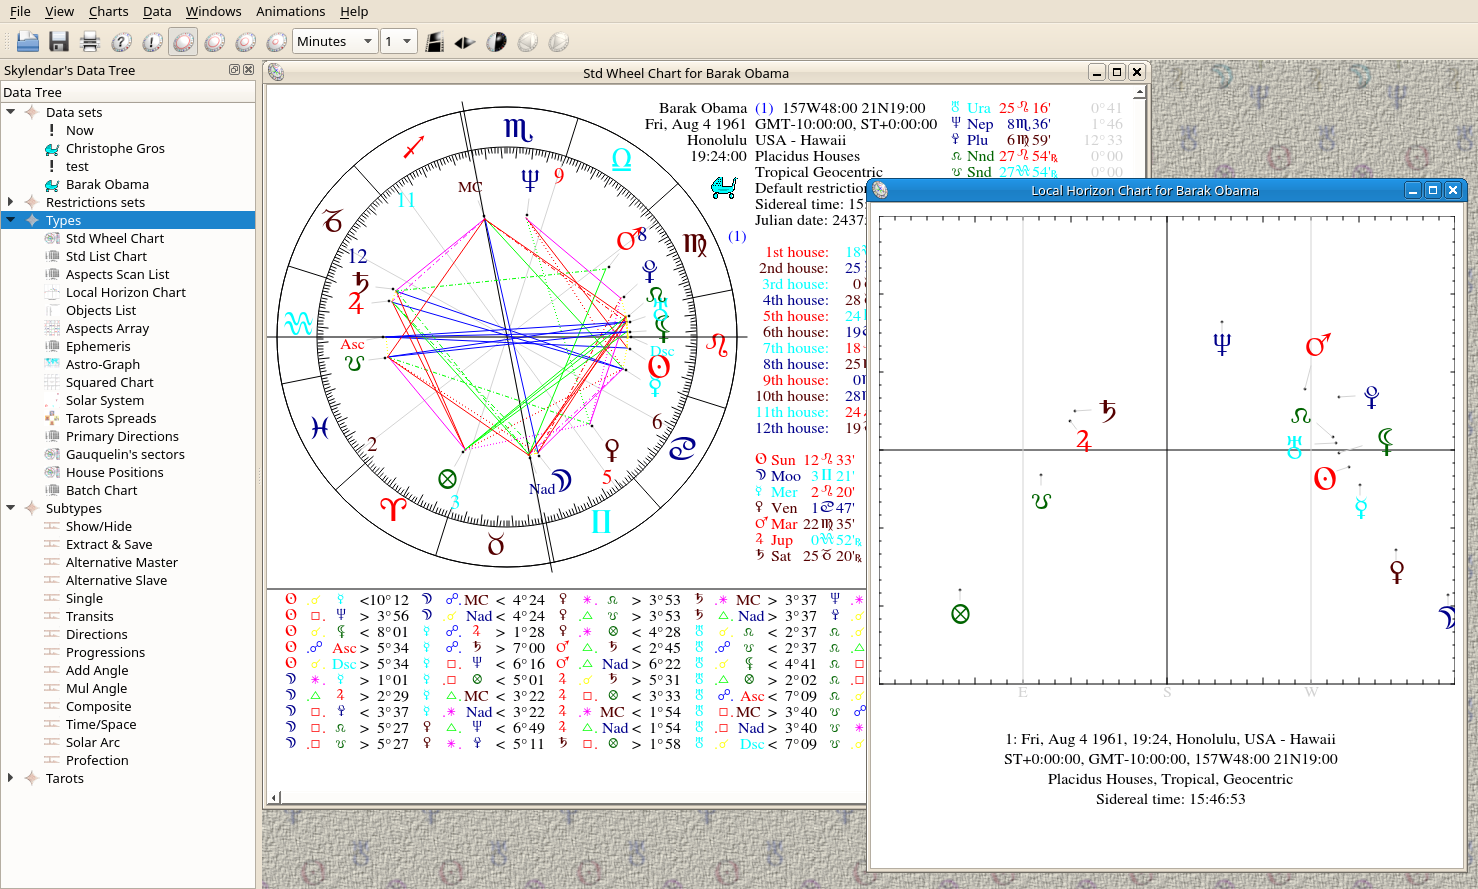
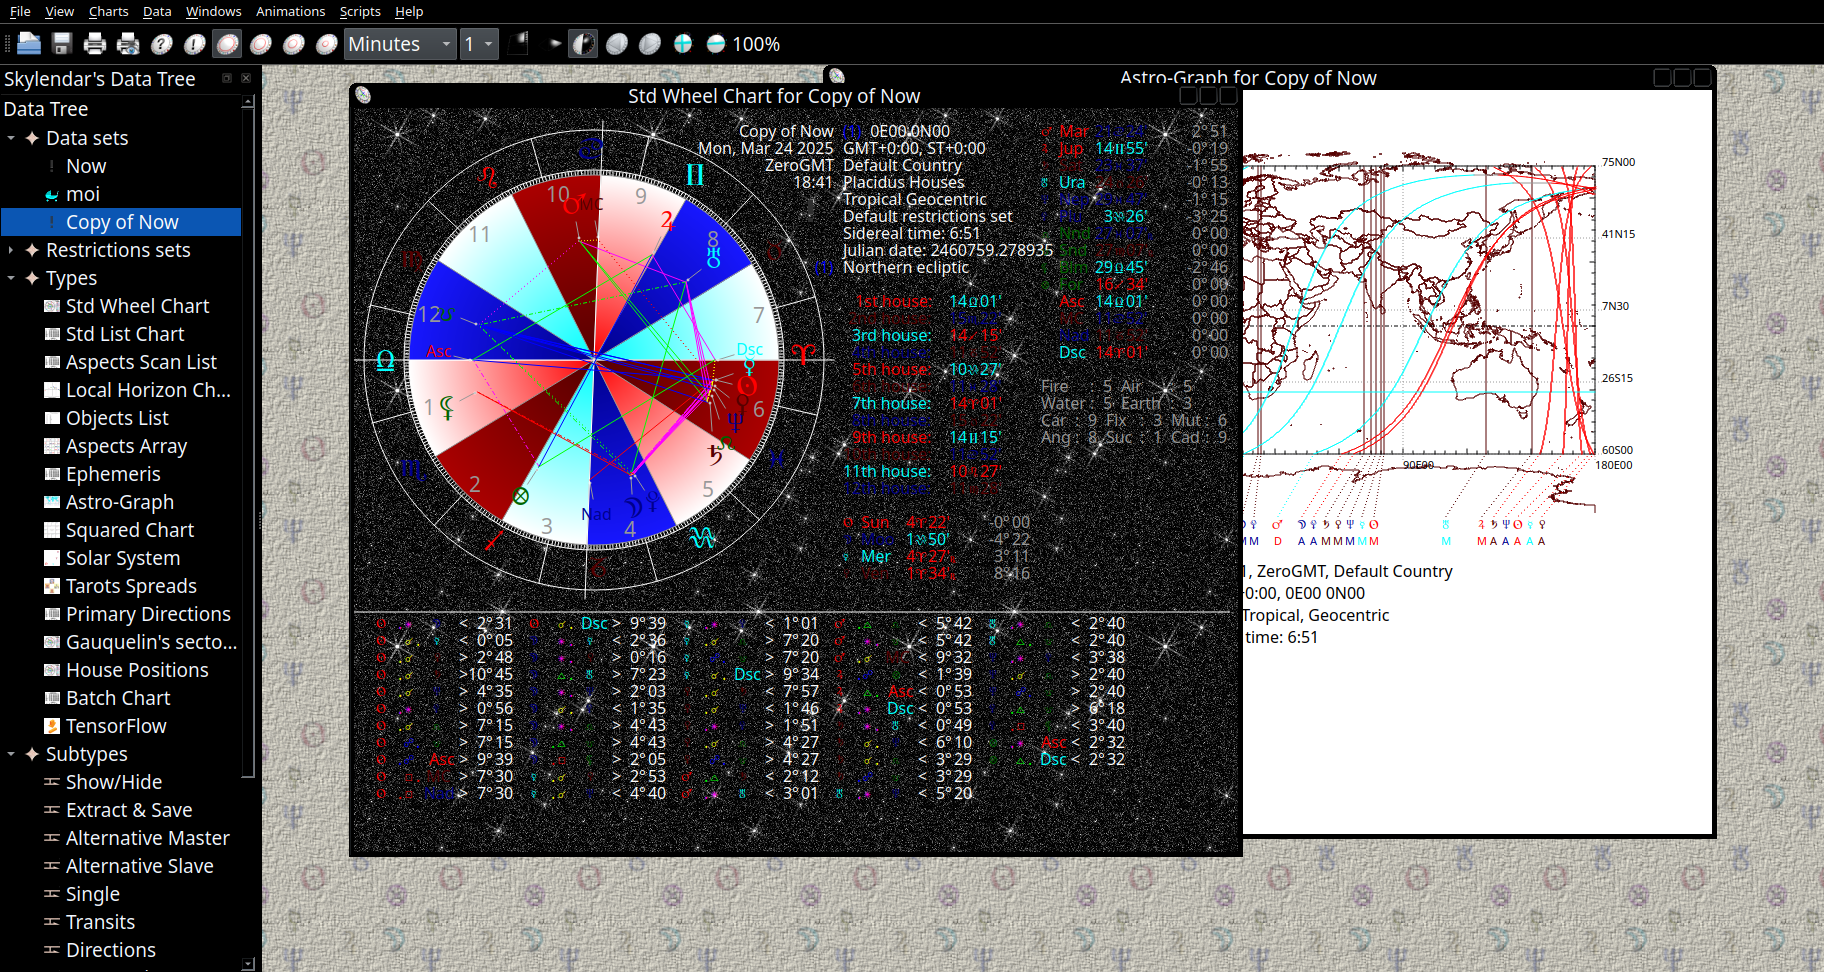
The Skylendar main window is basically divided in two vertical parts: an icon tree for data/restrictions sets, subchart management, etc... and a workspace where all the graphic charts are displayed.
A data set groups together all the time and place info needed to cast a chart for a person or a situation. Those sets can be saved into and retrieved from the SQL database.
All the displayed planets or aspects and their orbs, colors, etc... are contained in restrictions sets. Those sets can be saved into or retrieved from the database like a data set.
Before running the application itself, you must initialize the database, and grant an access at least to your own username. See the Skydmin utility. Then, when you run Skylendar The database name, user name, password and hostname will be asked.
Skylendar works according to the drag and drop system. Dragging a data or restrictions set icon, and dropping it onto a displayed chart will recompute and redisplay the affected chart with respect to the dragged data.
Each displayed chart can manage up to 4 Rings, i.e. simultaneously
used data sets on the chart.
The toolbar shows 4 icons, like  ,
which selects the affected data for the next drag'n'drop operation.
,
which selects the affected data for the next drag'n'drop operation.
In addition to the data and restrictions sets, the user can manage subcharts, i.e. actions performed on selected data sets in charts, such as hiding/displaying a data set or changing its subchart type, e.g. Transiting, Progressed, etc.... Here is the list of the available subchart types:
Single: Standard positions. See below
Transiting: Standard transits
Progressed: 1day = 1 year
Directions: a simple plaicidan like direction along the equator, 1 degree = 1 year, without declination.
AddAngle: will add an arbitrary value to the longitude of the available objects. Thus, you can get a Symbolic direction subchart if you add 1.0 degree per year. See below
MulAngles: will multiply the given value with the longitude of the available objects. Thus, you can get an Harmonic subchart if you use integer values, such as 2.0, 3.0, 7.0, etc...
Composite: will replace the current values by the midpoints of all the matching objects computed from the first available ring and the current ring
Time/Space: will do the same, but with respect to the average time, latitude and longitude
Solar Arc: will multiply the birth solar step with the number of years of the current ring
Profection: same as Progression but 1 sign per year
Double click on either Add Angle or Mul Angle icon in order to set the suitable value
A single subchart is the basic subchart type. A single subchart can't send aspects; it only receives them, unless 2 single and displayed subcharts remain visible on a chart. Thus, aspects can be computed between both of them. If only 2 non-single (i.e. transiting, progressed an directed) displayed rings remain on a chart, the aspects are naturally computed between them.
All the non-single rings are computed with respect to the Master ring, i.e. the outermost single ring. They are named Slave ring. In addition, it is possible to define an Alternative Master, i.e. any available ring. All the Alternative Slave rings will be computed with respect to the first declared Alternative Master.
Sophisticated queries can be submitted to the database through the data sets search dialog box. One can search a data set simply by name or by birth date, sex, comment, type, etc.., or even by values, i.e. all the data sets which have the planet x in sign y, or the planet x and y linked with the aspect z, and so on.
| Prev | Contents | Next |
| Introduction | Up | Data Edition |